


For consumers today, the first experience with an organization or brand is often online—whether through visiting a website, responding to an email campaign, or conducting a health-related search. And, those first experiences shape opinions of the organization, both good and bad. As healthcare organizations strive to manage and improve the customer experience, listening to the voice of digital customers is a must.
By taking the time to truly understand and measure the experience of website visitors, marketers can evaluate whether their organization’s website is helping or hurting its brand. Following are some insights from research gathered over the last two years through gSight℠, a healthcare-specific online popup survey tool used by hospitals and health systems across the country. Data shared represent 2017 benchmarks as collected from thousands of completed web surveys.
First Time Visitors Outnumber All Other Categories
In surveys of more than 24,000 visitors to hospital or health system websites, the single largest response for “How often have you used this site?” is “This is my first time.” That means this is your only chance to make a good first impression. Knowing how first-time visitors “feel” when they visit your site is critical information for campaign planning and driving new business to a website or landing page.
On average, nearly 40 percent of website visitors are there for the first time (figure 1). Imagine knowing that 40 percent of the patients in your emergency department on a given day are there for the first time, or that 40 percent of the people on your mailing list are reading your newsletter or annual report for the first time. How would you welcome them? Would you design messages differently? Would you have a welcome message directed specifically to first time customers? How about someone to help them navigate around your hospital? As you consider some of the findings from this national research, think about what your organization might do differently if you knew these things to be true about your site…because statistically, it probably is.
Figure 1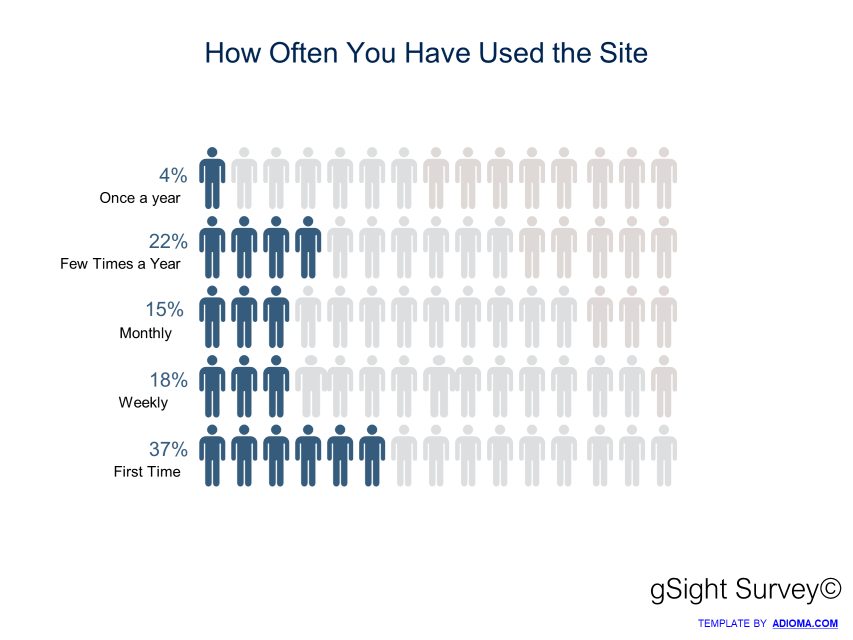
What is Your Website Communicating About Your Brand?
Getting the graphics right, like logos and colors, is the easy part, and even getting the messaging on brand is usually achieved. But what is the experience of using your organization’s website saying about the brand promise you claim there and elsewhere? So much is communicated by the experiences created, whether live, virtual, or digital, yet tying those experiences back to what is said can be an enormous challenge for communicators.
On the plus side, survey responses indicate that most website visits reinforce or create new positive perceptions about the hospital’s brand (figure 2). What’s concerning, though, is that, on average, 8 percent of website visitors say their experiences are creating new negative brand perceptions–and the percentage ranges from 2 percent to 13 percent across organizations involved in the survey. At 8 percent, if a website has 10,000 monthly visits, and 800 of those visitors now have negative perceptions about the organization that were not present before and, as a result, elect to go elsewhere for care, that’s 800 times 12 times the average annual revenue a patient represents lost to the organization over the course of a year.
Figure 2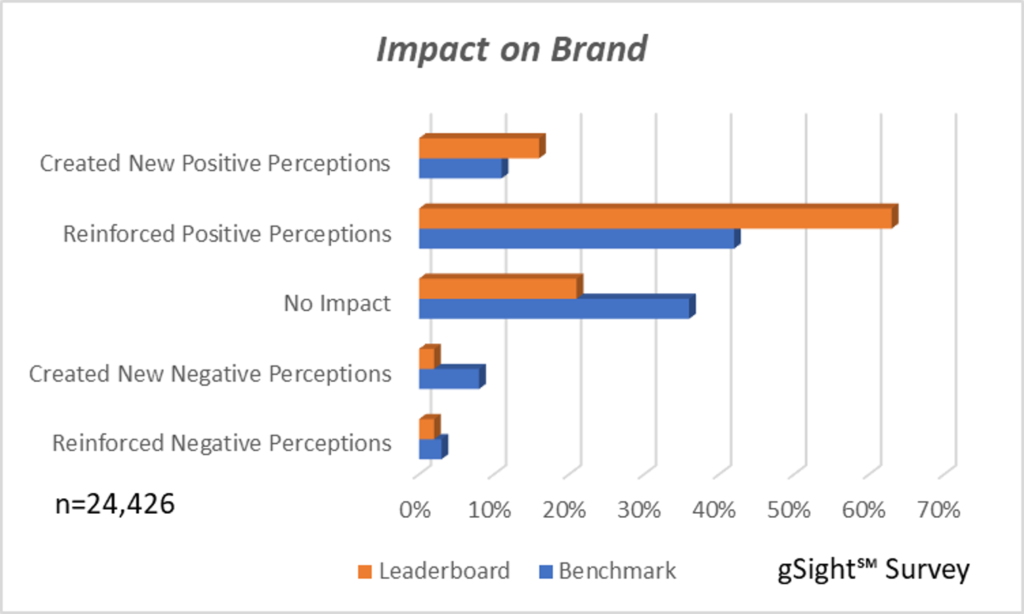
Benchmark represents the average scores across all studies combined.
Leaderboard scores are based on ratings from respondents who gave “5 Stars” or said “the experience was exceptional.”
Digital Brand Moments
Research shows that people aren’t wired to think in terms of numbers on a scale when it comes to an experience. So, when evaluating website features and functionality, it makes sense to give respondents three points of consideration formatted in easily related phrases around the “brand moments” that make up the experience, such as content, navigation, transactions, speed, and ease of use.
In the gSightSM survey, points of consideration include 1) needs no improvement; it’s fine as is, 2) the moment needs some minor improvement, and 3) the moment needs major improvement. Recognizing that not everyone experiences the entire site, respondents also have the option to say 4) I didn’t experience it (to avoid forcing false negatives or positives) or 5) I experienced it, but I just don’t remember it, with the two latter statements allowing measurement of how memorable the experience was for the visitor. “Memorable” allows for reframing the responses to create a meaningful representation and provides two constructs in one question. By using responses 1-3 as memorable, and responses 4 and 5 as not memorable, a memorability score can be calculated. Then, by resetting the variable to only responses 1-3, a “needs improvement” score can be determined.
Those touchpoints that are rated both most memorable and in need of improvement should be priorities for marketers and the web team. Frequently these touchpoints relate either to navigation, content, or functionality of the transaction elements.
Figure 3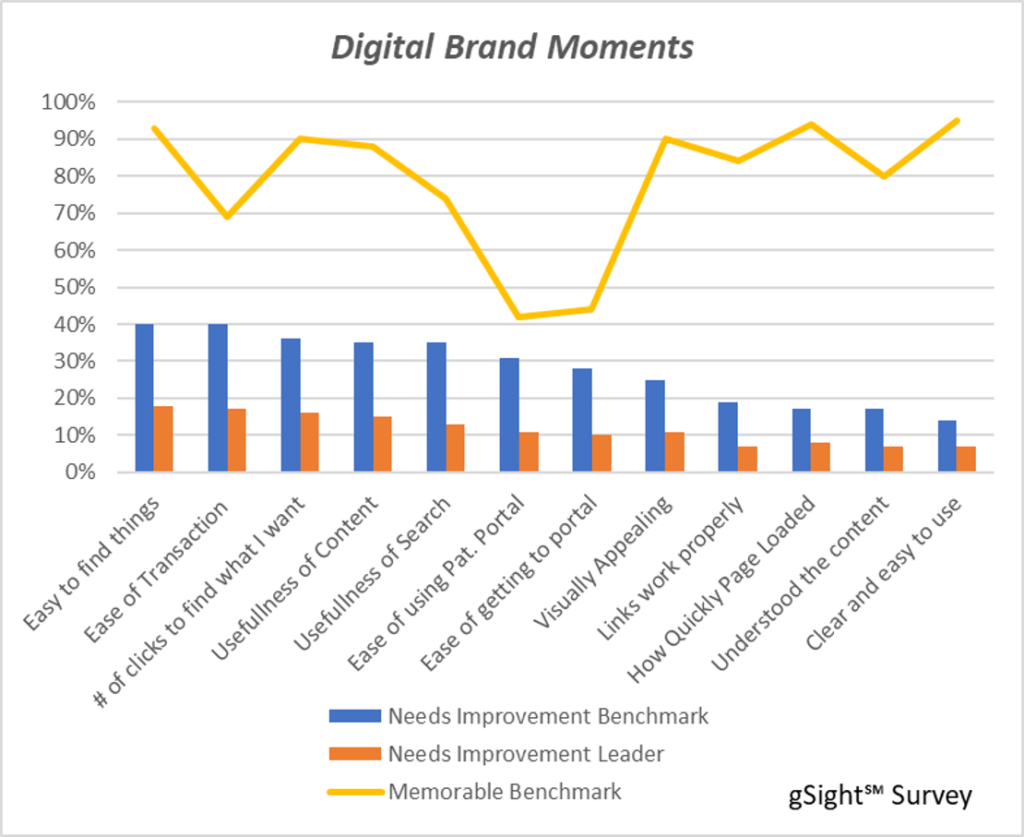
Reasons for Visiting the Site
While healthcare organizations can spend as much as 80 percent of their resources building and managing content, it is not always content that is driving traffic to websites (figure 4). Visitors today are largely arriving for transactional reasons, such as paying a bill, finding a physician, scheduling an appointment, getting to a portal, applying for a job, making a donation, or retrieving test results. Armed with this information, how can web designers make these transactions easier for visitors?
Many of these applications may be outside the influence of marketing and communications. Finance, scheduling, and clinical applications are often the front door once your visitor leaves the home page. But being able to deliver effective messaging as visitors embark on the next leg of their journey may be the solution to creating a better experience—and that’s where marketers and communicators come in. They can help explain why physician bills can’t be accessed from the bill pay page, for example, or offer suggestions for understanding the bill. The challenge is to convince colleagues outside of marketing and communications that what visitors experience when they use existing sites or systems can be improved by simply communicating better. Having the data can help make the case.
Figure 4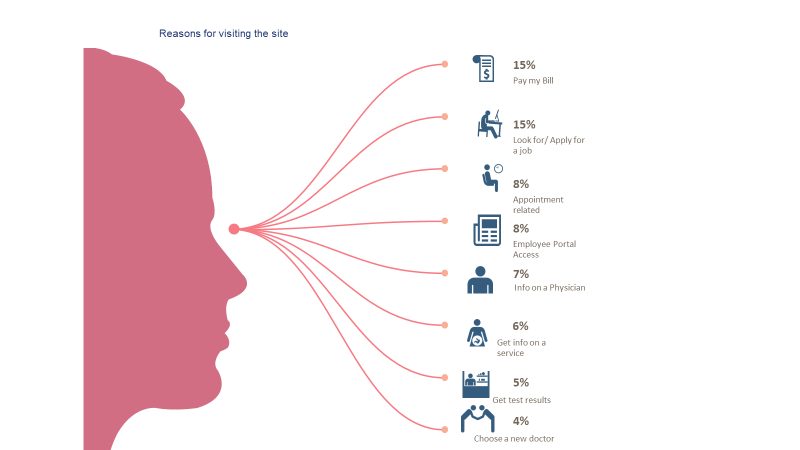
Likelihood to Use the Website Again
Most hospital website visitors (90 percent) say they are likely to use the website again, but not always because they want to or because they found the site useful (figure 5). In fact, 35 percent said they’ll use it again because they have to. Ask yourself, is this a captive audience or are these prisoners?
Figure 5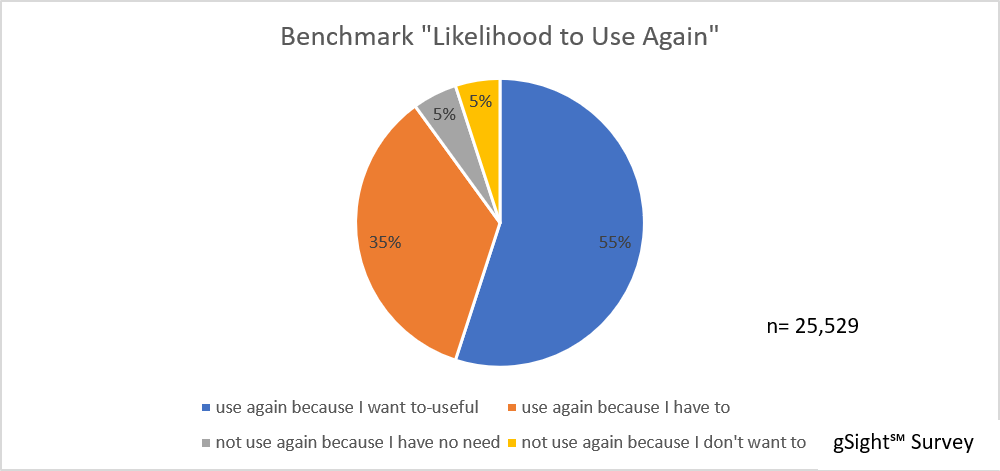
Marketers and communicators should consider ways to ensure that a captive audience is a happy audience—one that not only has access to needed services and desired content, but enjoys an experience that goes above and beyond expectations. For instance, are there ways to tag frequent visitors to welcome them back, highlight changes since their last visit, and make suggestions for features or services they might be interested in, as Amazon does? And, how can we influence not only content but important elements of engagement that are missing today? Armed with data on the existing digital experience, platforms can be created to facilitate and advance these important conversations.
Author’s Note:
As helpful as this data is, readers should be cautioned that even though this data is statistically significant at very high confidence levels, survey participants were responding to specific website experiences, and your unique visitors will have unique experiences. While much of the information in this article is generally applicable to all organizations, data at the individual hospital website level varies greatly from organization to organization. Primary research on your website is a critical element of any overall web or digital strategy. Then, knowing how it compares to the industry can help you prioritize and plan for ongoing improvements.

Candace Quinn, CandaceQuinnConsulting.com, is a consultant to gSight℠ as well as an independent healthcare marketing consultant.